Every lawn care pricing chart on page one prints the same two columns: the service, and the price. Some add a time estimate. Not one of them prints the third column — the one that decides whether the row is a business or a hobby.
That column is what the price leaves after the crew standing on the lawn has been paid.
This post fills it in. Four charts were read directly on 5 September 2026, their numbers are quoted exactly as published, and every one of them is then run against a single working book so the rows can be compared on the same terms. Two more page-one sources returned HTTP 403 to our fetch and are left out entirely rather than summarised from a search snippet.
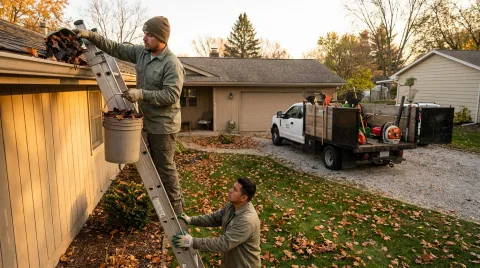
One row this chart cannot show is the add-on that pays best per hour on the same driveway. On the book above, a mowing stop brings in about $62 of revenue per crew-hour once the drive is counted; a one-story gutter cleaning sold on the fall cleanup visit brings in $129, a two-story $143, because the drive was paid for by the cleanup and the only cost that scales is ladder time by story. How much to charge for gutter cleaning, with the ladder math.
What four published charts actually say
Start with the hourly rate, because every other number on every chart is derived from it. Read the same afternoon:
| Source | Published hourly range | Date on the page |
|---|---|---|
| Invoice Fly | $25 – $80 | Published 13 May 2025, updated 27 Jun 2026 |
| Jobber | $30 – $65 | Published 11 Mar 2026, updated 12 May 2026 |
| Housecall Pro | $35 – $68 | Published 28 Apr 2026, updated 24 Jul 2026 |
| GorillaDesk | $40 – $80 | No date shown |
The floors disagree by 60% — $25 against $40 — and the ceilings by 23%. Four sources, one trade, one week.
Now the single most-quoted row in the category, the quarter-acre mow. Bucket labels differ between sources, so each is named as published:
| Source | Bucket as published | Price |
|---|---|---|
| Jobber | ¼ acre | $25 – $60 |
| Invoice Fly | Small, 1/8 – ¼ acre, per visit | $35 – $45 |
| GorillaDesk | Quarter acre | $40 – $80 |
| Housecall Pro | Under ¼ acre, typical weekly rate | $41 – $65 |
Low ends run $25 to $41, a 64% spread. High ends run $45 to $80, a 78% spread. If you were hoping a chart would tell you what to charge, four of them just told you four different things about the same lawn.
The column none of them print
Here is the book every number in this post is run against. It is the same one used in our posts on aeration pricing and owner pay, so the figures stay comparable across all of them:
- 60 residential clients, mowed weekly
- 32-week season — 1,920 visits a year
- Two-person crew at $52.80 an hour, fully loaded: wages plus payroll taxes, workers' comp and paid time off, not the number on the pay stub
- 40 minutes per property, both people on site — so $35.20 of crew cost lands on every visit before the mower burns a drop of fuel
$35.20 is the line the whole category is arguing above and below without saying so. Add it as a column and the four published charts stop being a range and start being a verdict:
| Published price, quarter acre | Implied hourly rate at 40 min | Crew cost | Left over |
|---|---|---|---|
| $25 — Jobber, low | $37.50 | $35.20 | −$10.20 |
| $35 — Invoice Fly, low | $52.50 | $35.20 | −$0.20 |
| $40 — GorillaDesk, low | $60.00 | $35.20 | $4.80 |
| $41 — Housecall Pro, low | $61.50 | $35.20 | $5.80 |
| $45 — Invoice Fly, high | $67.50 | $35.20 | $9.80 |
| $52 — this book | $78.00 | $35.20 | $16.80 |
| $60 — Jobber, high | $90.00 | $35.20 | $24.80 |
| $65 — Housecall Pro, high | $97.50 | $35.20 | $29.80 |
| $80 — GorillaDesk, high | $120.00 | $35.20 | $44.80 |
Two rows on that table are negative. A third clears by twenty cents. And Invoice Fly's entire published range for its small-yard bucket — $35 to $45 — sits inside the band where this book is barely covering the people doing the work.
The same chart row, worth $105,600 a season
Multiply the left-over column by 1,920 visits and the published range stops being a rounding argument:
| Price per visit | Contribution across the season |
|---|---|
| $25 | −$19,584 |
| $35 | −$384 |
| $40 | $9,216 |
| $52 | $32,256 |
| $60 | $47,616 |
| $80 | $86,016 |
From the bottom of the published range to the top is $105,600 of season contribution on an identical book of work. Same 60 clients, same 1,920 visits, same crew, same 40 minutes. The only thing that changed is which row of which chart you copied.
That is the honest reason a pricing chart cannot tell you what to charge. It is not that the authors are careless. It is that the number depends on a cost they do not know and cannot ask about.
Where this book actually breaks even: $72.26 an hour
Crew cost is not the finish line. The truck, the trailer, the mowers, fuel, insurance, phone, software, the accountant, and every hour spent quoting instead of cutting all come out of what is left.
On this book, running the same numbers we used in the margin post, overhead lands near $24,900 a season. Spread across 1,920 visits that is $12.97 of overhead on every stop.
So the true floor is not $35.20. It is $35.20 plus $12.97:
- Break-even per visit: $48.17
- Break-even hourly rate at 40 minutes: $72.26
Now put the four published hourly ranges against that number. Across the four sources there are eight endpoints — $25, $80, $30, $65, $35, $68, $40, $80. Six of the eight sit below $72.26. Only the two $80 ceilings clear it, and neither source suggests $80 is where you should start.
Read that carefully, because it is the finding: on the most-searched pricing question in this trade, the published guidance mostly describes rates at which this book does not make money. Not rates at which it makes less money. Rates at which it makes none.
Inside one chart, the hourly rate swings from $40 to $130
GorillaDesk publishes a range of $40 to $80 an hour, then builds a twelve-row service chart. Divide each row's price by its own stated hours and the implied rate is not one number:
| Row as published | Hours | Price | Implied hourly |
|---|---|---|---|
| Mowing, trimming and blowing | 1 | $40 | $40 |
| Weed control | 1 | $40 | $40 |
| Yard cleanup | 1 | $40 | $40 |
| Leaf removal | 1.5 | $60 | $40 |
| Dethatching | 1.5 | $60 | $40 |
| Aeration | 3 | $120 | $40 |
| Seeding, new lawn | 4 | $265 | $66.25 |
| Overseeding | 1.5 | $165 | $110 |
| Fertilizing | 0.5 | $65 | $130 |
Nine rows, three different rates, no note anywhere explaining the difference. The explanation is obvious once you see it — seed and fertiliser are materials, and the labour-only rows are not carrying product — but the chart does not say which rows include materials and which do not. A reader pricing off it has no way to tell whether $65 for fertilising covers the bag.
The deeper problem is the six rows sitting at exactly $40. The source's own published range tops out at twice that. Copy the chart and you have adopted $40 an hour as your shop rate without ever deciding to — a rate $12.80 below what a two-person crew costs to have on the lawn, and $32.26 below where this book breaks even.
The leaf removal row that loses $19.20 as printed
One row is worth isolating, because it is the clearest case of a published price colliding with a published time.
GorillaDesk lists leaf removal at 1.5 hours for $60. A two-person crew for 1.5 hours costs $79.20. The job as published loses $19.20 before overhead, fuel, or hauling the leaves anywhere.
The same service on the other two charts that price it: Housecall Pro says $150 to $600, Invoice Fly says $75 to $600. GorillaDesk's number is $15 below the lowest figure either of the others will print and one quarter of Housecall Pro's floor. Our own leaf removal pricing workup lands in the same territory as the higher two, and for the same reason: hauling is the cost nobody puts in the chart.
Aeration is calmer but still wide — GorillaDesk $120, Jobber an average of $140, Housecall Pro $75 to $205, Invoice Fly $75 to $500 and up.

The only pricing chart that is about your market
Every chart above is a national average built from somebody else's route. Your market has its own labour rate, its own drive times, its own competitors and its own willingness to pay. There is exactly one dataset that reflects all four, and you already own it: your paid invoices.
The 25th to 75th percentile of what you have actually collected — the middle half, outliers dropped — is a better pricing chart than anything on page one, because it is the only one drawn from customers who said yes at your prices in your ZIP codes.
Landscapey computes exactly that. If you opt in, your public profile can show a typical job range built from the interquartile range of your own paid invoice totals, friendly-rounded, and it stays hidden until you have at least five paid invoices behind it so the number is not noise. It is the same figure that should be driving your quotes.
Two honest limits on that: it describes what you have charged, not what you should. And if you have been pricing off a $40-an-hour chart for three seasons, your invoice history will faithfully report a losing rate. The arithmetic above is what tells you whether the range you are looking at is a floor or a trap.
Price is half the equation. The minutes are the other half.
Everything above holds the clock at 40 minutes. Move it and the whole table moves with it.
At $52 a visit, the same job at 50 minutes costs $44 in crew and leaves $8.00 — a 52% cut in contribution from ten minutes. At 30 minutes it costs $26.40 and leaves $25.60, a 52% gain. Ten minutes per stop is worth more on this book than a $10 price increase, and it does not require a single awkward conversation.
Across 1,920 visits, ten minutes a stop is 320 crew-hours a season — $16,896 at $52.80. That is where drive time, route order and stop density stop being an operations detail and start being the pricing decision. It is also why the two levers belong together: charge a rate that clears $72.26 an hour, then shorten the hour.
What we can and cannot do here
Landscapey is $19.99 a month, listed against $29.99 as launch pricing, or $199.99 a year against $359.88 — two months free, $16.67 a month. Both carry a 14-day trial that asks for a card. Invoices are paid by card through Stripe direct charges and we take 0% of the payment. Recurring work bills either flat monthly or per visit, which is the choice we pull apart in the recurring billing post. Route optimisation is in the same plan, because the minutes half of this equation is not an add-on.
What we do not do, stated plainly because this post is about pricing:
- No pricing calculator, no estimating module, no bid builder. If you want software that produces the number for you, this is not that tool.
- No payroll. We will not compute your fully-loaded labour rate — the $52.80 in this post is a figure you have to bring, and getting it wrong invalidates every row above.
- One login per business, no crew accounts. If your foreman needs their own seat, we are the wrong fit today.
- The typical-range figure needs five paid invoices before it shows anything.
Building a pricing chart that is yours
Six steps, in order, none of which require a chart from the internet:
- Get your loaded crew rate. Gross wages, plus payroll taxes, workers' comp, and paid time off, divided by billable hours — not hours worked. This is the only number in the exercise you cannot borrow.
- Time ten real stops. Wheels-stopped to wheels-rolling, including the trimmer and the blower. Use the median, not your best day.
- Add overhead per visit. Annual overhead divided by annual visits. On the book above that was $12.97; on yours it will not be.
- Set the break-even. Crew cost plus overhead. Anything below it is volunteer work with a mower.
- Add the margin you actually need, not a target you read somewhere. Work backwards from what you need to draw — the arithmetic is in the owner salary post.
- Check it against your own paid invoices. If the rate you just built is above what the middle half of your book pays, you have a repricing job ahead, and the price increase letter is the next thing to read.
Jobber's own 2026 Home Service Trends Report, surveying more than 1,000 home-service owners, reports that 65% raised prices in the past year. Whatever else that number means, it means your competitors are not holding still, and neither is the chart you copied in 2023.
If you want the invoice history that makes step six possible, start a free trial or look at what it costs first. If you are earlier than that and still working out how to structure a bid at all, our neighbour post on how to bid landscaping jobs covers the process side — this post is about the numbers that go into it.
Frequently asked questions
What is a fair hourly rate for lawn care in 2026?
The four charts read for this post publish floors of $25, $30, $35 and $40 and ceilings of $65, $68, $80 and $80. On the 60-client book above, break-even is $72.26 an hour — which six of those eight endpoints sit below. A rate is only fair relative to your loaded crew cost, so compute that first and treat published ranges as a sanity check, never as a target.
How much should I charge to mow a quarter-acre lawn?
Published prices for that exact lawn ranged from $25 to $80 on the same day. On this book, $48.17 is break-even at 40 minutes and $52 leaves $16.80. If your crew is faster or cheaper the number drops; if you are hauling clippings or fighting slopes it rises. Anyone quoting one figure without asking your crew cost and your minutes is guessing.
Why do lawn care pricing charts disagree so much?
Because they are averaging different regions, different crew sizes and different service definitions, and because most of them never state which figures include materials. One chart in this post prices nine rows at implied rates of $40, $66.25, $110 and $130 an hour with no note explaining why.
Should I price by the hour, by the lawn, or by square foot?
Quote a flat price per visit — customers will not accept an open clock — but build that price from an hourly rate you have verified. Square-foot pricing is a shortcut that ignores obstacles, slope and gate access, which are exactly what make one quarter acre take twice as long as another.
Does charging more mean losing customers?
Some, yes. The arithmetic that matters is how many you can afford to lose. On this book, moving from $47 to $52 a visit raises contribution per stop from $11.80 to $16.80, a 42% gain — so the price holds its ground even if you shed a quarter of the route. Losing the wrong quarter is the real risk, which is a routing problem more than a pricing one.
How do I know what my own market pays?
Your paid invoices. The middle half of them — the 25th to 75th percentile — is the only pricing data drawn from customers who said yes at your prices in your ZIP codes. Landscapey computes that range from your paid invoice totals once you have at least five of them.
One last reason the $16.80 matters more than it looks. At the 2.4x SDE median, a client contributing $537.60 a season adds about $1,290 to what the business sells for, and thirty-two of them is worth a full multiple turn. We priced that out against nine published valuation rules in what a landscaping business is actually worth.
Sources and limits
- Four sources, read directly on 5 September 2026: GorillaDesk's lawn care pricing chart (no date shown on the page), Housecall Pro (published 28 Apr 2026, updated 24 Jul 2026), Jobber (11 Mar 2026, updated 12 May 2026) and Invoice Fly (13 May 2025, updated 27 Jun 2026). Every price quoted above is theirs, transcribed as published.
- Two page-one sources are missing on purpose. Angi and GreenPal both returned HTTP 403 to our fetch. Their figures appear in search snippets, and characterising a source from a snippet is how the errors in this category propagate, so they are excluded rather than paraphrased.
- The 60-client book is an illustration, not a survey. 60 clients, $52 a visit, a 32-week season, a two-person crew at $52.80 an hour fully loaded, 40 minutes a stop, roughly $24,900 of annual overhead. It is deliberately the same book used across our aeration, leaf removal, winter and owner-salary posts so the numbers stay comparable. Your loaded rate is the input that moves every conclusion.
- The 65% price-increase figure is Jobber's own survey of more than 1,000 home-service owners, reported in its 2026 Home Service Trends Report. It is a vendor's research about its own market and is cited as attributed, not independently verified.
- Landscapey's own prices were checked against our live pricing page the day this was written, not recalled. Competitor prices move; if you are reading this months later, verify before quoting any of it.